Data Management and Climatology
High quality data is needed for climate analysis with sufficient spatial coverage and duration. For climate applications projects, demands of meteorological data in terms of coverage, frequency and immediacy are more stringent than for climate analysis. Thus both for climate analysis and project work, data must be collected. The data resources in Sri Lanka are rich and are often only in paper form, inaccessible and expensive. Over the years, we have sought to acquire and organize data for our research in climate and climate risk management. We have carried out quality assessment of key data.
| Activity |
Objectives
|
Partners | Status | Next Steps |
| Data Management |
Obtain and manage data resources including meteorological, hydrological, sectoral and societal data.
Include in suitable databases. |
Data librarian, MASL. |
Sufficient data for work in hydro-climatic analysis at all available locations are being
archived. Records have been collected from global and local data sources. |
Collection of daily records needs improvement. Collection of monthly data and database development needs
to be completed. Updating of data needs to be organized. Malaria data management in progress. |
| Quality Control of Data |
Quality assessment of meteorology and agriculture measurements. Methods extended to hydrological data.
|
IRI |
QC of rainfall and temperature (min, max and mean) of all meteorological stations and agro-meteorological
stations completed and Technical Reports prepared. |
Create a PC-based tool for quality control. Extend QC methods to entire database. Conduct QC on malaria
and hydrology data. Develop methodology for daily data records |
| Climatological Mapping |
Prepare an Atlas of climatology in Sri Lanka |
University of Peradeniya, Iowa State University, MASL, NASA/GSFC Land Surface group. |
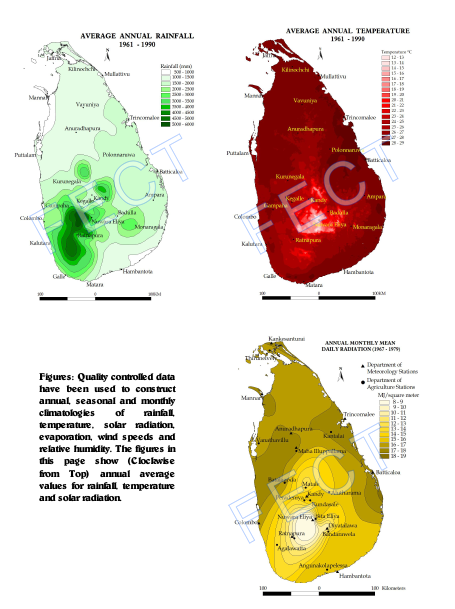
Climatologies of rainfall,mean, maximum and minimum temperature, solar radiation mapped. Modeled wind,
soil moisture and evaporation. |
Mapping to be refined. Mock of publication to be completed. Digital map library to be completed. |
Data Resources
Systematic weather observations started in 1868. By 1900, there were 90 observation stations. Since then there
have been up to 1000 stations at one time or another and regular rainfall records are maintained in half of
these.
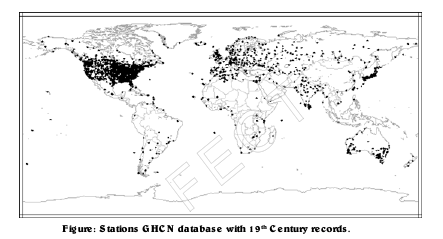
Compared to other tropical countries, Sri Lanka has excellent meteorological data. The map below
shows the stations that provided data to the global archive named Global Historical Climate Network (GHCN) in the
19th Century. Sri Lanka is the region in the tropics with the densest network of stations.
Quality Control of Climate Data
Errors arise in climate data due to instrument error, observation errors and transcription errors. Such errors
can unduly influence climate analysis particularly for climate change. Therefore we need to assess the quality of
the data. Such procedures are useful to infill missing data.
Climate analyses is sensitive to outliers
arising from a variety of sources, like shifting of the stations, instrumental errors and human error. Hence,
prior to analysis it is important to remove outliers.
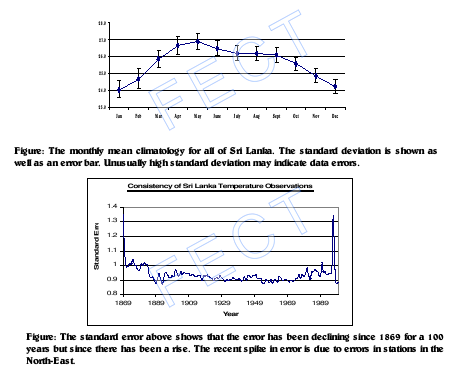
Temperature fields should show spatial
uniformity. An anomalous rise in one station is likely to be associated with a similar rise in neighbouring
stations. Therefore we may compute the standard error for each year for the anomalies for each station to assess
the degree of scatter in a given year for stations across the country as a measure of quality.
Such
quality analysis gives a way to build homogeneous and complete data set and reconstruct the discarded or missing
data.
Climatologies
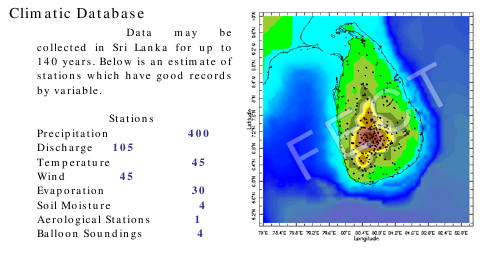
Climatology
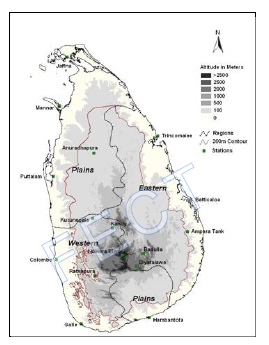
Given its size, Sri Lanka shows a remarkable variation of climate among its regions. The variation in temperature is modest with the mean value being 27oC with a mean daily range of 6oC. The relative humidity varies from 60% to 90%. Westerly winds prevail over the island from May to September and North-Easterly winds prevail from December till February. Rainfall measurements are available for Colombo from 1853 and there are a dozen stations which have a 130 year rainfall record and over 500 rainfall recording stations with a 50 year record. Some of these stations are shown in the figure below along with the topography.
Regionalization
- annual rainfall (as wet, dry and intermediate),
- elevation (as up, mid and low country) and based on
- agro- ecological zones (considering rainfall, elevation and soils).
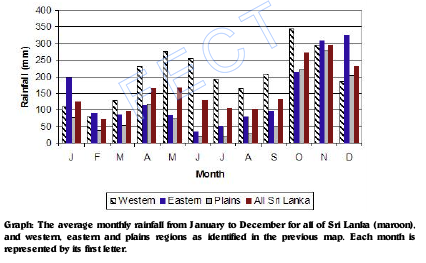
Monthly Regional Rainfall
Rainfall is high from October to December and from April to June through all regions of the island. During the intervening periods, rainfall is augmented on the western hill slopes from May to September and on the eastern hill slopes from December till February.
Seasons
There is no clear cut method of specifying seasons for Sri Lanka. Traditional agricultural seasons are from -
- October to March (Maha)
- April to September (Yala).
- Meteorologists have demarcated the seasons as the
- North-East monsoon (DJF)
- First Inter-Monsoon (MA)
- South-West monsoon (MJJAS) and
- Second Inter-Monsoon (ON)
Meteorological demarcation is useful for studies of wind and temperature patterns but does not separate modes of rainfall well. For analysis of rainfall, we often use a breakup of the agricultural seasons into their wetter early half (AMJ and OND) and drier later halves (JAS and JFM).
Output
Conference Proceedings
Dec 1999: with Gunaratne, A.U.K, A mass consistent wind model for Sri Lanka, Proceedings of the 8th Asian Fluid Dynamics Congress, Shenzen, China 8:817-820.Dec 2002: with Heli Bulathsinhala, Quality Evaluation of Mean Historical Temperature Data in Sri Lanka, Sri Lanka Association for the Advancement of Science, 58th Annual Sessions, University of Colombo, Colombo, Sri Lanka.
Abstracts submitted:
Nov 2004, Climate change assessment for Sri Lanka from quality evaluated data. International conference on sustainable water resources management in the changing environment.July 2004, Topographically informed interpolation of temperature in Sri Lanka. Submitted to: First national symposium on Geo-Informatics, PGIA, Sri Lanka.
Reports
November 2005: Manjula Siriwardhana, Janaki Chandimala, Siraj Razick, Upamala Tennakoon and Lareef Zubair, FECT Technical Report -7, 2005, Quality evaluation of diurnal temperature range in Sri Lanka.
November 2005: Manjula Siriwardhana, Heli Bulathsinhala, Kusalika Ariyarathna, Irugal Bandara, Janaki
Chandimala, Siraj Razick, Upamala Tennakoon and Lareef Zubair, FECT
Technical Report-3, 2004, Quality Evaluation of Historical Rainfall Data in Sri Lanka.
May 2005: Manjula Siriwardhana, Kusalika Ariyarathne, Irugal Bandara, Heli Bulathsinhala, Janaki Chandimala,
Siraj Razick, Upamala Tennakoon and Lareef Zubair, FECT Technical Report-2, Quality evaluation of
historical maximum and minimum temperature data in Sri Lanka.
February, 2005, Current Climate and Climate Change Assessments for Coconut and Tea Plantations in Sri Lanka.
Submitted to: START, Washington, D.C., USA,
December 2004: Irugal Bandara, Kusalika Ariyarathne, Janaki Chandimala, Siraj Razick, Manjula Siriwardhana, Upamala Tennakoon and Lareef Zubair, FECT Technical Report-4, Quality evaluation of historical maximum and minimum temperature data in the agro-meteorological stations in Sri Lanka.
December 2004: Heli Bulathsinhala, Manjula Siriwardhana, Kusalika Ariyarathne, Irugal Bandara, Janaki Chandimala, Siraj Razick, Upamala Tennakoon and Lareef Zubair, FECT
Technical Report-1, 2004, Quality evaluation of historical mean temperature data in Sri Lanka.