Scientific question: Small-scale processes
Through the measurement of the position of the entrainment interface (microwave radiometer) as well as the vertical and horizontal velocities (VAD modes of LiDAR), it is possible to measure the rate of entrainment as a function of the gradient Richardson number. This measurement can be used to estimate the downward buoyancy flux at the entrainment interface, and near-surface tower measurements will provide information on the buoyancy flux at ground level. Some questions to be answered, using measurements at all stations, are:
- What is the vertical structure of winds, temperature, mixing ratio and Richardson number? How does this change from the transition period of monsoons to fully developed monsoons and during monsoon breaks?
- What is the entrainment rate as a function of the (interfacial), Ri-g.? Are these changes in consonance with the shear-breakdown mechanism proposed by Bhat & Fernando (2014) as well as laboratory findings of Strang & Fernando (2001)? What is the contribution of convective activities?
- How does the interfacial , Ri-g.?. change with the onset and continuation of monsoons? And, can it sustain a substantial downward buoyancy flux?
- Is the entrainment possible at , Ri-g.?> 0.25, and how long does this entrainment last? How does the interfacial stability (Richardson number) change during an entrainment event?
- How do surface energetics, including incoming and outgoing solar radiation and surface buoyancy flux, evolve?
- Do the eastward- and northward-propagating disturbances modify the entrainment mechanisms? Time lagged observations from Seychelles and Sri Lanka will be helpful in this regard.
The large-scale disturbances are discussed below:
Using equipment deployed for at least a year and data from observational networks, we will investigate the following:
- Are there [oscillatory] convective activities in the two sites? Climatological information suggest that the main MJO initiation takes place in the central IO from October to March, with the highest occurrence probability near the equator during October to January (Zhang & Dong 2004). The observations of the Dynamo Experiment were made during October to March 2012 (Yonayama et al. 2013), and the proposed winter and summer observations will add value to or complement those from Dynamo.
- What are the generation mechanisms of northeastward propagating equatorial disturbances? One of the suggested mechanisms is related to a positive shortwave-radiation anomaly that develops north of equatorial convection region. It warms up the sea surface, increases the low-level convergence and moist static energy and destabilizes the atmosphere, thus leading to northward propagating equatorial convection. This and other plausible mechanisms will be pursued via observations.
- Is there coherence between observations at our locations? We will analyze the surface pressure, temperatures and upper level moisture (mixing ratio and liquid water content). What are the phase speed and wave length of propagating disturbances? Can we identify those using existing theoretical frameworks (e.g., westward-propagating Rossby waves, equatorial Kelvin waves)? The interest is not only eastward-propagating perturbations, but also the much slower, northward-propagating, component.
- What are the time scales of convective activities – their initiation, maturation and decay?
Simulation Using WRF Model
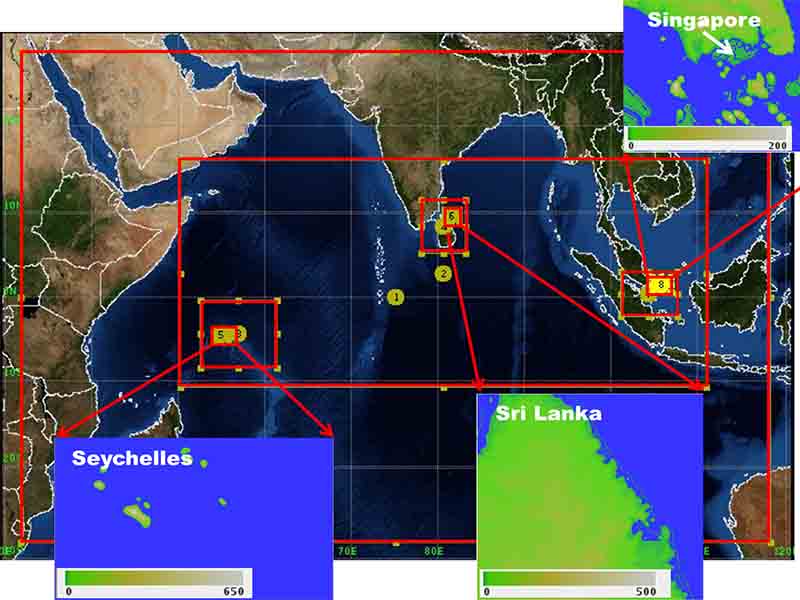
In addition to observations, simulations are conducted using the Weather Research and Forecasting (WRF) Model. Nested domains for WRF simulations: Domain 1 with 64km grid, Domain 2 with 16km grid, Domains 3,4 and 7 (below 8) with 4km grid, and Domains 5, 6 and 8 with 1km grid. The terrain height (color bar) is shown in meters.