Is the air pollution analysis for the Sampur Coal Plant credible?
Newspaper Articles
Web Articles
-
SL Guardian
By Dr. Lareef Zubair
Summary- Sampur coal plant
Sri Lanka’s second coal fired thermal power plant is implemented as a joint venture of Ceylon Electricity Board and National Thermal Power Corporation (NTPC) of India. The Joint Venture Company has been incorporated as Trincomalee Power Company Limited on 6th September 2011. Trincomalee Power Company Limited is responsible for implementation and operation of the 2 X 250MW coal power plant in Sampur. The total estimated cost of the project would be USD 512 Million. The Sampoor Coal Power Plant will comprise two 250 MW power generators. The power generated will be transmitted to the national grid through high voltage transmission lines from Sampoor through Habarana to the Veyangoda Grid Substations. Power Purchase Agreement, Implementation Agreement, BOI Agreement, Land Lease Agreement and Coal Supply Agreement were signed on 07 October 2013 by relevant parties including GOSL, CEB and JV Company. Project is expected to be commissioned before end of 2017.
Project Details
- Sponsor: Trincomalee Power Company
- Parent: Joint venture between Ceylon Electricity Board and NTPC
- Location: Sampur, Trincomalee district
- Coordinates: 8.486111, 81.3 (exact)
- Status: Permitted (Units 1-2); Pre-permit development (Units 3-4); Announced (Units 5-6)
- Gross Capacity: 500 MW (Units 1&2: 250 MW), with possible extension by an additional 2x250 MW and 2x300 MW
- Type:
- Projected in service: 2017
- Coal Type:
- Coal Source:
- Source of financing: India and/or Japan International Cooperation Agency
Is the air pollution analysis for the Sampur Coal Plant credible?
Where does the wind take pollutants from Sampur?
As per modern myth, school texts, and national atlases, the wind blows from the North-East over Sri Lanka at the turn of the calendar year. Even the birds know it. The transcontinental migrants draft on the North-Easterly winds to steer to Hambantota for the Siberian winters. However, the analysis of atmospheric pollution in the Environmental Impact Assessment (EIA) for the coal burning power plant proposed at Sampur presumes that the wind blows from the South-East.
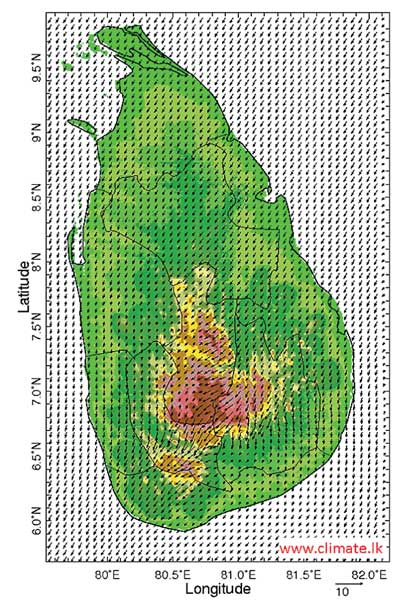
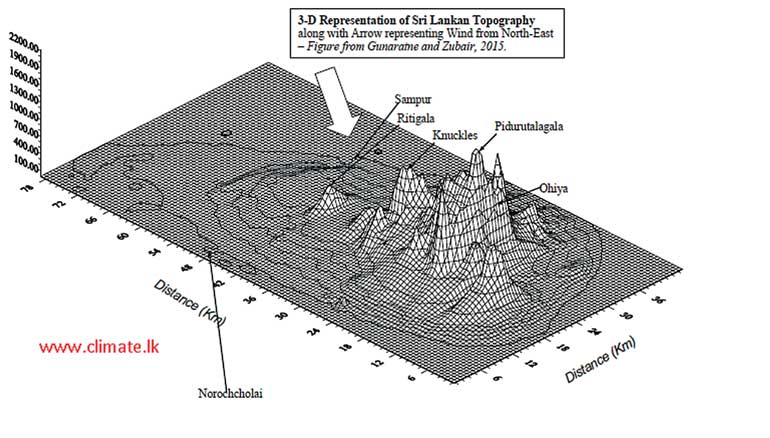
If the wind is from the North-East, it shall entrain the pollutants from Sampur towards the central mountain ranges from Ritigala to Namunukula. Mountains amplify the impacts of pollutants on atmospheric chemistry and cloud physics. Even modest rise in toxic gases can have damaging consequences on the air people and animals breathe, the water they drinks, and ecosystems. This can impact the quality of tea and hydropower production.
Coal burning power plants release dust and pollutants and toxins such as Mercury into the atmosphere. Every year, the Sampur plant is projected to vent 10,000 tons of sulphur dioxide, 10,000 tons of nitrous dioxide, 1,700 tons of other particulate matter and other toxins and four million tons of carbon dioxide. These are monumental quantities that cry out for serious attention.
To show that this is safe, the EIA consultants from New Delhi, Mantec Ltd., rely on a computer model which tries to mimic the venting of these chemicals into the atmosphere. Such computer models are built on crude generalisations and shaky assumptions. To mitigate the shortcomings, all available data should be used after careful quality control and the results should be cross-examined.
The wind over Sri Lanka from December to February
Mantec relies on one year of observations by CEB at Sampur and another month of their own measurements. This is a hundredth of the wind observation that are available. It may be that the CEB instruments observed something extraordinary over Sampur in after December 2012. This possibility should be entertained after cross checking the data against observations in the neighbourhood.
Usually when one undertakes environmental observations in a new site, stringent checks should be undertaken. Often there are instrument errors, calibration errors or simply misalignment or errors in recording data. No reports on quality control have been presented. The windrose shown is consistent with the Mantec finding that the wind from December to February comes largely from the South-East.
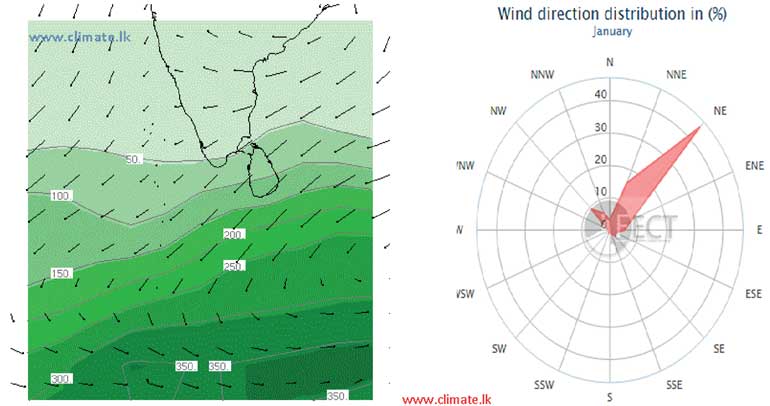
The wind directions for December to February that Mantec has presented are at odds with measurements from the Department of Meteorology, the Air Force, by the Ceylon Electricity Board (CEB) elsewhere and our own institute in Kandy. Satellite wind observations and climate model simulations too present North-Easterly flows. There are dozens of research papers to confirm this.
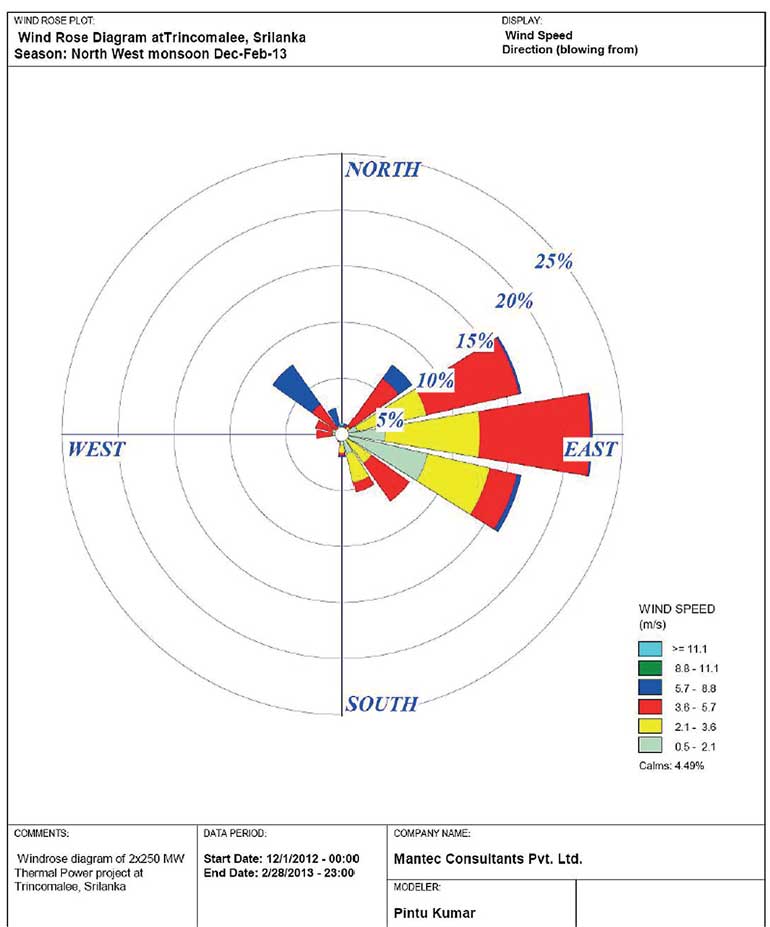
Left: The ‘Windrose’ is a representation of which direction the wind comes from for December 2012 to February 2013. The distribution of wind speeds from each direction is shown in colour – Courtesy: Sampur EIA from Mantec.

Nitrous oxide pollution for Dec-Feb period as estimated by Mantec: The contours shows the peak concentration of nitrous oxides for a day due to the emissions. We inset an arrow to show the South-Easterly wind direction that the wind comes from according to the EIA. Notice, the contours with higher concentration is drawn towards the South-East – Source: Mantec EIA Report.
Assumptions and generalisations regarding wind and air pollution in the EIA
There are other causes for concern. Mantec has made the following inter-locking assumptions and generalisations:
(a) The wind measurements in Sampur represents the wind across the East: A better accounting of regional variation in wind is needed. There are variations due to location, storms, mountains and sea breeze. The sea-breeze and the desiccating mountain slope winds (“kachchan kaththa” in Tamil) that affects Sampur in a particular way.
(b) Wind observations at Sampur can be extrapolated to higher elevations: The CEB instrument does not reach the high elevations that the pollutants travel to. It is hard to capture the wind profile at higher elevations without observations. The assumptions in the software about the upper air should have been verified for our specific equatorial geography.
(c) One year of wind observations is enough: The wind varies substantially from year to year variation of wind in Sri Lanka. For example, in some years there are storms and even cyclones. In other years, the El Nino alters the wind flow. One just cannot use just one year of data to project for the next half century if serious.
(d) The past can represent the future: With decadal and climate change (which we have documented for Sri Lanka), one cannot assume that the past represents the future. The EIA does not address the risks posed by climate change such as more frequent intense rainfall, cyclones, sea level rise or changing wind and storm patterns all of it of relevance for Trincomalee.
These shortcomings could have been mitigated by making use of all available data, consulting past research, addressing inconsistencies and communicating what risks this analysis has not addressed.
Pollution concentrations on the ground according to the EIA
Anyway based on these data and assumptions, the Mantec model estimates dispersion of dust, nitrous oxides, sulphurous oxides and particulate matter under idealised conditions. For example, there are no plant breakdowns or accidental large releases. Essentially the model projects how much of the dust shall settle in the region surrounding the power plant. They limit their analysis to 20 km. The wind data for December to February largely blows from in-between the East and South-East.
The output from the Mantec model perplexes – for example, in the December to February period, the pollutants are carried towards the South-East and into the sea. In other words, the pollutants go against the wind. Nowhere on the earth’s surface is passive matter known to go against the wind.
In an attempt to validate the Mantec model results, the Industrial Technology Institute was contracted by Mantec to undertake similar simulations. The ITI model too relies on similar assumptions and generalisations. They too use only one year of wind data albeit from a climate model run in the US. Not enough information is given in the EIA for comparison across seasons. However, the patterns of dispersion of pollutants they project is misaligned with that from Mantec and the pollutant concentrations is several times that from Mantec. The EIA does not reconcile the discrepancies.
What can we infer for mountains and the atmosphere above us?
Wind and rainfall in the North-East Monsoon
As the North-Easterlies winds take moist air up the mountain slope, it encounters cooler temperatures. As it cools, the water vapour in the air condenses into tiny droplets. These droplets forms only on tiny impurities that are found even in the pristine air in the East. These droplets keep growing into clouds until they are large enough till they burst and fall as rainfall. This mechanism is what gives us the heaviest rainfall on the eastern slopes of our hills from December to February.
Increase the pollution levels even modestly, and the droplets shall become a mist rather than a rain cloud and pass over the mountains and onwards West. Not only can such slight increases in pollution reduce rainfall, it can also reduce solar radiation and change evaporation. It can reduce the flow in our eastern streams and disturb the ecosystems from the hills to the eastern coast directly.
Impacts of pollution streams into the mountain slopes
The sulphurous and nitrous oxide emissions along with the heavy metals can lead to toxic rainfall. This can have far reaching consequences on our climate, the health of humans, ecosystems, water supply, air we breathe, the quality of tea, agriculture, and hydropower generation. The contamination shall be not only on the eastern mountain slopes but be carried to the eastern slopes and over the mountains.
Two decades back, Prof. Oliver Illepurama’s research group undertook studies in Kandy and reported that air pollution levels for some of the gases released at Sampur were hazardous – things have only got worse since. Thus in Kandy, the only place we have data, we see a need to check the additional risk from Sampur.
Learning from other coal plants
The surroundings of the Norochcholai Power Plant are covered in dust, particularly when the wind blows from the South-West. No Government body monitors and reports on it. And one can only describe this as wilful and convenient blindness by the State.
As poorly anticipated, monitored and mitigated as the air pollution at Norochcholai is, the consequences at Sampur can be worse. The wind field and topography is such that the pollutants from Norochcholai are entrained away from our mountains but not that from Sampur.
Some argue that combustion technology and air scrubbing system is more advanced at Sampur Power Plant. This assurances needs to be taken with caution. A model “clean technology” coal power plant was installed 3 years ago in Mississippi, USA in much more advantageous circumstances, and despite all the promises and state support, it has only left massive pollution far beyond the projections (New York Times, 5 July).
Credibility of the air pollution analysis
When anyone proposes to experiment with our atmosphere by injecting millions of tonnes of chemicals for multiple decades, we should take extraordinary care. We must have air pollution projections which are transparently done, are scientifically defensible, and undertaken with integrity, technical competence and professionalism. The results should be presented openly and reviewed independently and widely including to those directly affected.
By using air pollution models which are limited by design in what it can anticipate, by using input data that are suspect, by not consulting what is already known, by providing no credible validation, and limiting the checks to pollution levels at the ground alone, the EIA process for the coal plants has not credibly addressed the danger ahead.
[Lareef Zubair is a researcher at the Foundation for Environment, Climate and Technology (http://www.climate.lk and http://www.tropicalclimate.org). Shashini Rathnayake, Janan Vishwanathan and Zeenas Yahiya of FECT contributed.]